参考链接:
https://github.com/velocyto-team/velocyto.R
http://velocyto.org/velocyto.py/index.html
http://pklab.med.harvard.edu/velocyto/notebooks/R/chromaffin2.nb.html
https://htmlpreview.github.io/?https://github.com/satijalab/seurat-wrappers/blob/master/docs/velocity.html
https://github.com/velocyto-team/velocyto.R/issues/16
https://www.cnblogs.com/raisok/p/12425258.html
# 目录
RNA 速率:使用 Seurat 的结果做 RNA velocity
# 导入 Seurat 以及 loom 对象
>library (Seurat) | |
## remotes::install_github ('satijalab/seurat-wrappers') | |
>library (SeuratWrappers) | |
## 导入 Seurat 对象,之前分析的结果 | |
>load ("wang.rds") | |
>load ('wang-loom.rds') |
# 统一 loom 对象和 Seurat 的细胞名与基因名
> wt$spliced[1:3,1:3] | |
3 x 3 sparse Matrix of class "dgCMatrix" | |
WANG:AAAGTAGAGATGTTAGx WANG:AAACCTGTCAGCATGTx WANG:AAAGCAACATTTGCTTx | |
AT1G01020 . . . | |
AT1G01030 . . . | |
AT1G03993 . . . | |
> wang@meta.data[1:3,1:3] | |
orig.ident nCount_RNA nFeature_RNA | |
AAACCTGAGAATTCCC-1 zxz 3756 2158 | |
AAACCTGAGGGCACTA-1 zxz 2774 1669 | |
AAACCTGAGTAATCCC-1 zxz 2463 1290 | |
> colnames(wt$spliced)<-gsub("x","-1",colnames(wt$spliced)) | |
> colnames(wt$spliced)<-gsub("WANG:","",colnames(wt$spliced)) | |
> colnames(wt$unspliced)<-colnames(wt$spliced) | |
> colnames(wt$ambiguous)<-colnames(wt$spliced) |
# 计算 velocity
提取 spliced 与 unspliced 文件,并提取原有的 Seurat 的 UAMP 图
## 由于 Seurat 的对象筛选了数据,所以两个文件细胞并不相同,以 Seurat 对象为准 | |
> wt$spliced<-wt$spliced [,rownames (wang@meta.data)] | |
> wt$unspliced<-wt$unspliced [,rownames (wang@meta.data)] | |
> wt$ambiguous<-wt$ambiguous [,rownames (wang@meta.data)] | |
> sp <- wt$spliced | |
> unsp <- wt$unspliced | |
> WTumap <- wang@reductions$umap@cell.embeddings | |
## 估计细胞和细胞的距离 | |
> cell.dist <- as.dist (1-armaCor (t (wang@reductions$umap@cell.embeddings))) | |
> fit.quantile <- 0.02 | |
> rvel.cd <- gene.relative.velocity.estimates (sp,unsp,deltaT=2,kCells=10, cell.dist=cell.dist,fit.quantile=fit.quantile,n.cores=24) |
# 在 UMAP 聚类图上绘制 RNA velocity
library(ggplot2) | |
pdf("cell_velocity.pdf",height=6,width=8) | |
gg <- UMAPPlot(wang) | |
ggplot_build(gg)$data | |
colors <- as.list(ggplot_build(gg)$data[[1]]$colour) | |
names(colors) <- rownames(WTumap) | |
p1 <- show.velocity.on.embedding.cor(WTumap,rvel.cd,n=30,scale='sqrt',cell.colors=ac(colors,alpha=0.5),cex=0.8,arrow.scale=2,show.grid.flow=T,min.grid.cell.mass=1.0,grid.n=50,arrow.lwd=1,do.par=F,cell.border.alpha =0.1,USE_OPENMP=1,n.cores=24,main="Cell Velocity") | |
dev.off() |
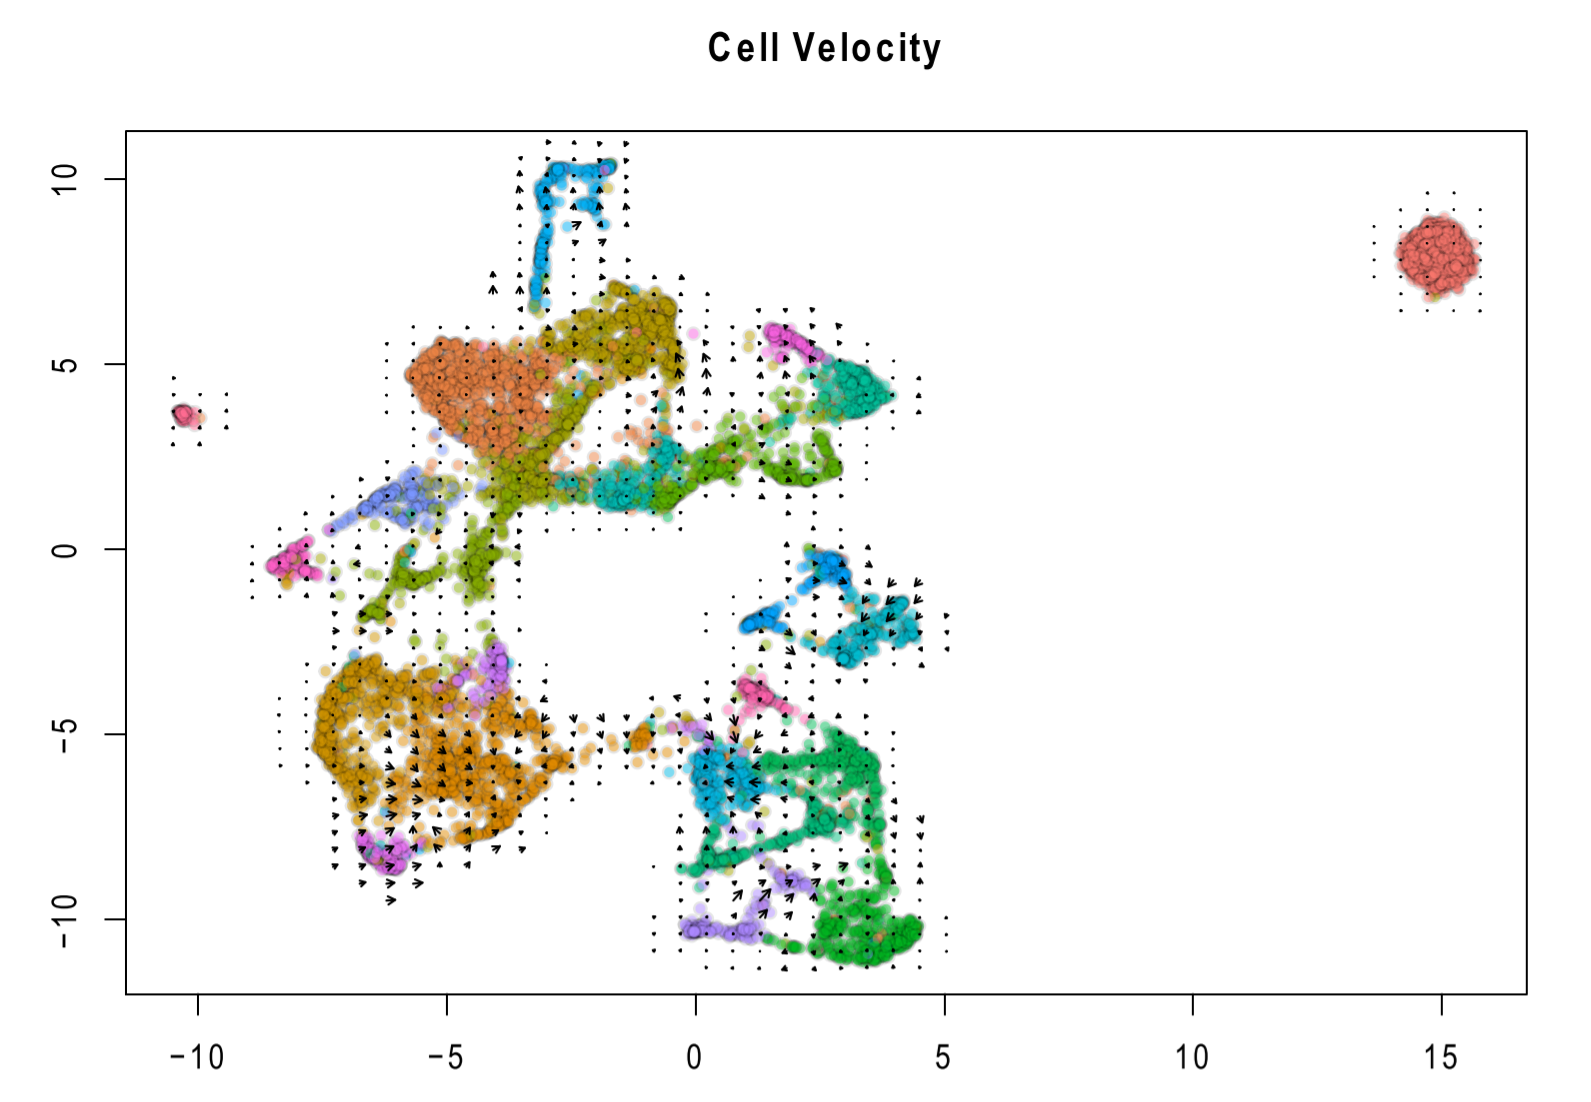
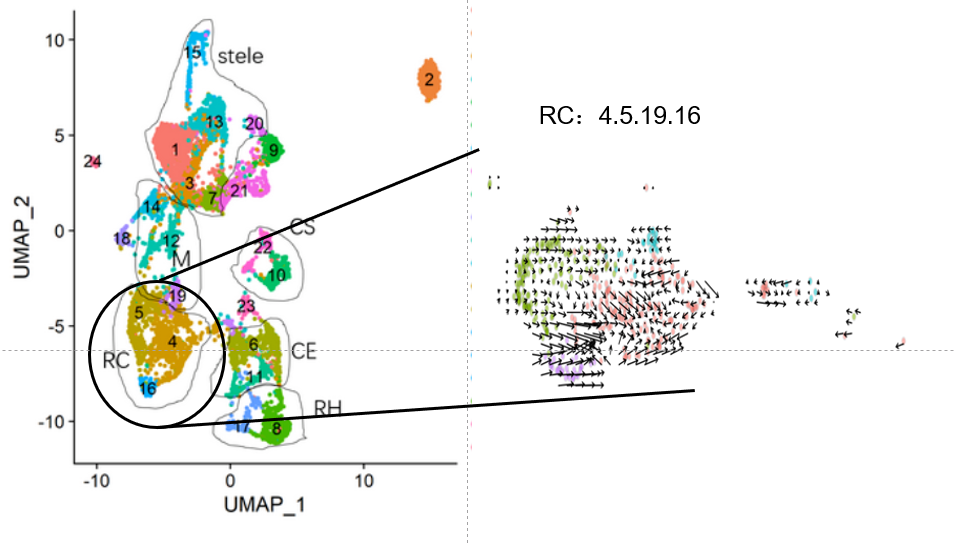
这结果根本看不出啥啊,我选 RC 试试
id<-c ('2','3','19','20') | |
Cell.sub <- subset (wang@meta.data,seurat_clusters==id) | |
scRNAsub <- subset (wang, cells=row.names (Cell.sub)) | |
## 后续的操作相同 |
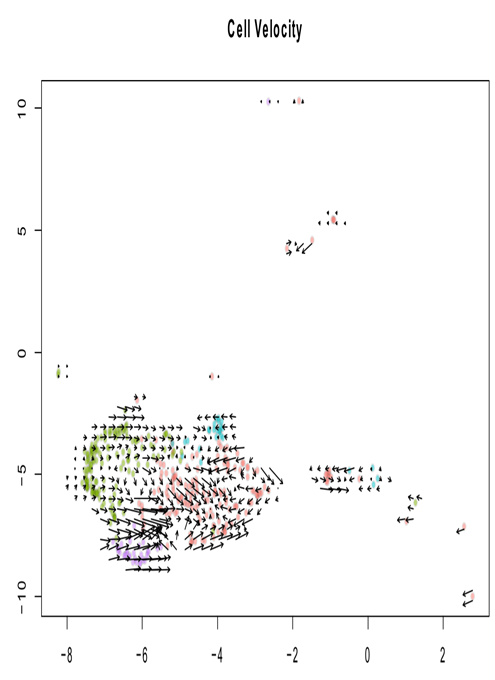
倒是有个轨迹,但是并不明显
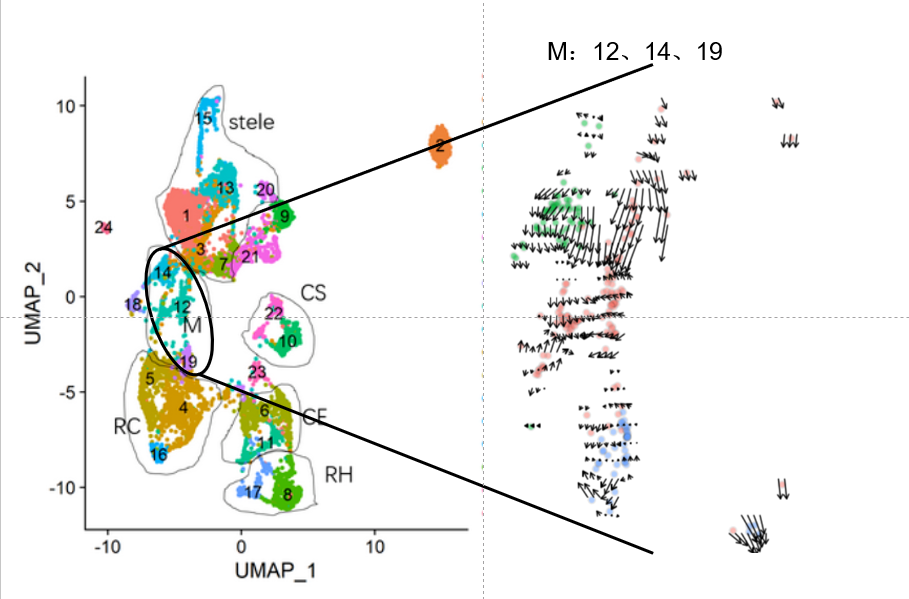
换成 cluster12.14.19 试试
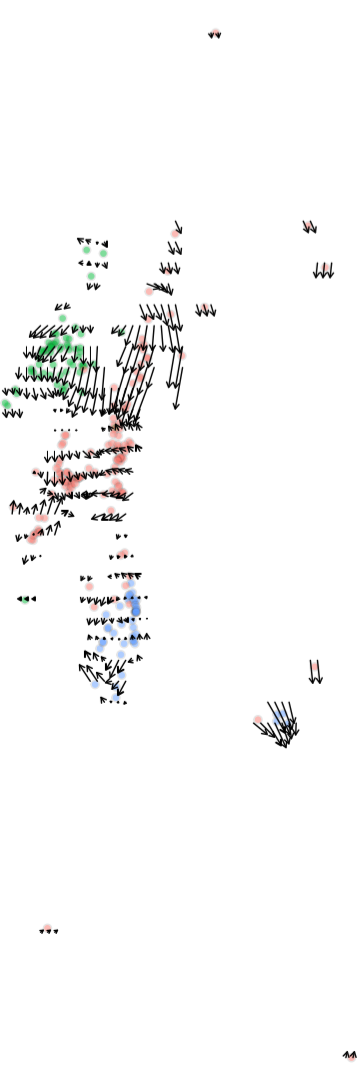
这一次就有一个明显的轨迹了
总体来讲,感觉植物做 RNA velocity 的结果并没有动物的那么好,是自己分析的问题还是其他原因有待商榷。