生信技能树单细胞数据挖掘笔记 (2):创建 Seurat 对象并进行质控、筛选高变基因并可视化
生信技能树单细胞数据挖掘笔记 (4):其他分析(周期判断、double 诊断、细胞类型注释)
# 降维,PCA 分析
load ("../2.3.Rdata") | |
### 4、降维,PCA 分析,可视化 ---- | |
# 先进行归一化(正态分布) | |
scRNA <- ScaleData (scRNA, features = (rownames (scRNA))) | |
# 储存到 "scale.data" 的 slot 里 | |
GetAssayData (scRNA,slot="scale.data",assay="RNA")[1:8,1:4] | |
# 对比下原来的 count 矩阵 | |
GetAssayData (scRNA,slot="counts",assay="RNA")[1:8,1:4] | |
#scRNA@assays$RNA@ | |
#PCA 降维,利用之前挑选的 hvg,可提高效率 | |
scRNA <- RunPCA (scRNA, features = VariableFeatures (scRNA)) | |
# 挑选第一,第二主成分对 cell 可视化 | |
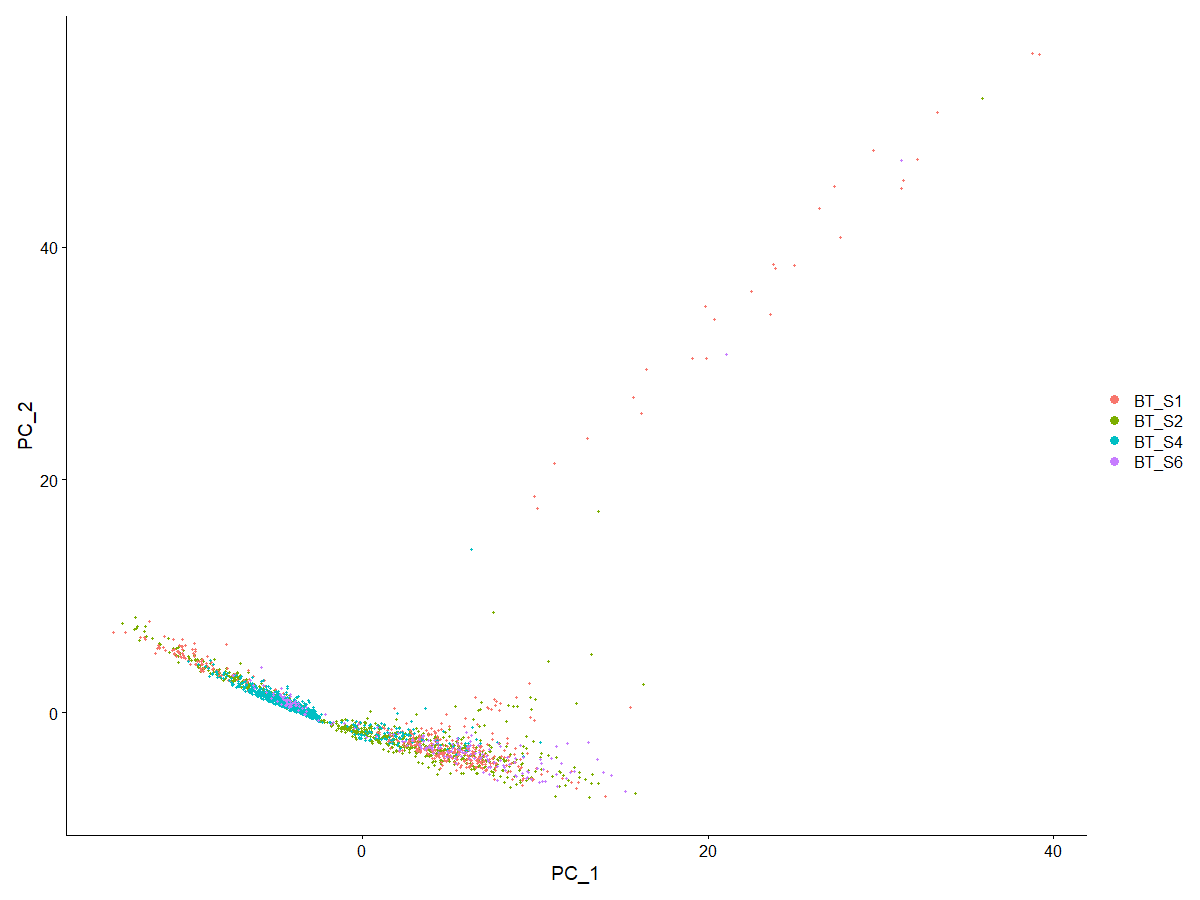
DimPlot (scRNA, reduction = "pca", group.by="Patient_ID") | |
# 发现与原文献中颠倒了 | |
#seed.use :Set a random seed. By default, sets the seed to 42. | |
#Setting NULL will not set a seed. | |
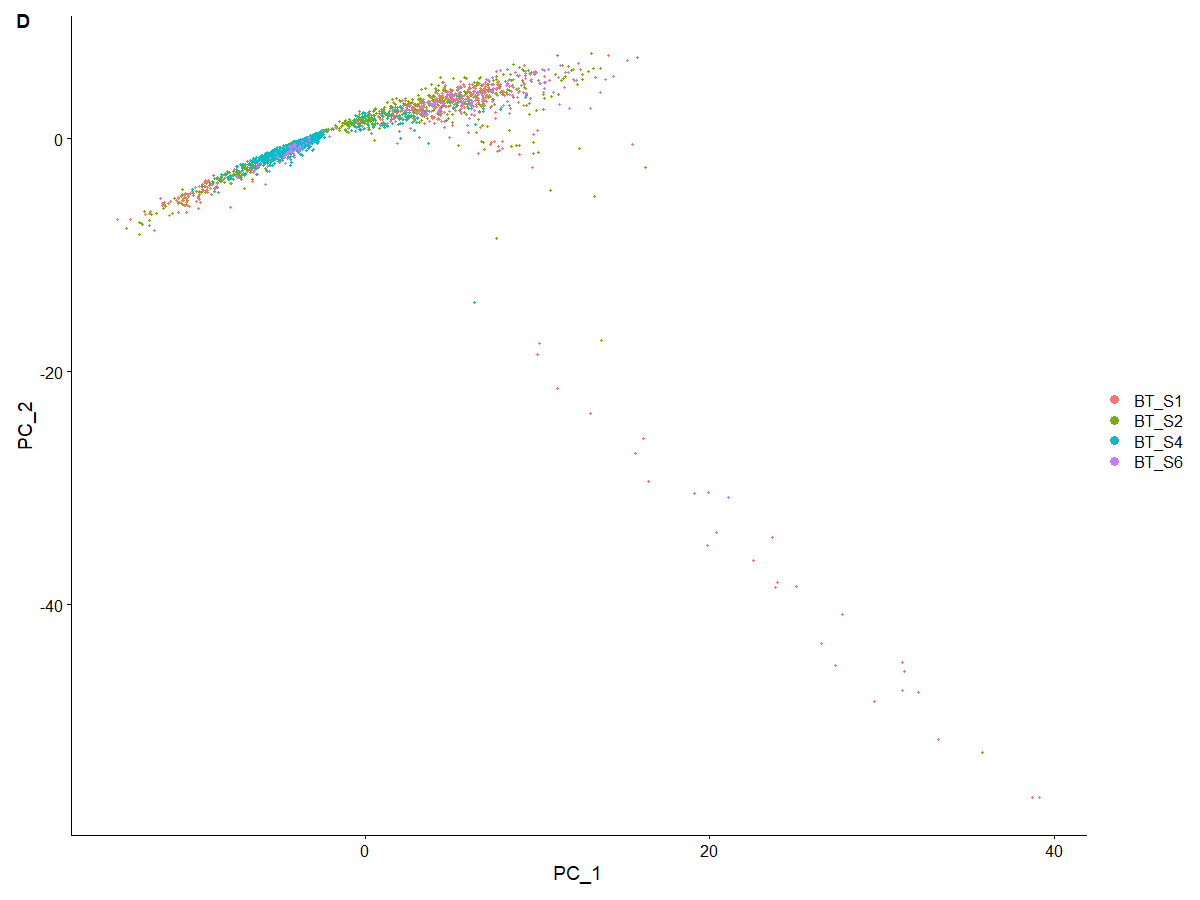
scRNA <- RunPCA (scRNA, features = VariableFeatures (scRNA),seed.use=3) | |
# 尝试了 seed.use 的不同取值发现图形只有四种变化(四个拐角),其中以 seed.use=3 为代表的一类与原文文献一致 | |
DimPlot (scRNA, reduction = "pca", group.by="Patient_ID") | |
# 与文献一致了。个人觉得颠倒与否如果只是随机种子的差别的话,对后续分析应该没影响 | |
p2_1 <- DimPlot (scRNA, reduction = "pca", group.by="Patient_ID")+ | |
labs (tag = "D") | |
p2_1 |
<center>
原图
</center>
<center>
seed.use=3 后的 PCA 图
</center>
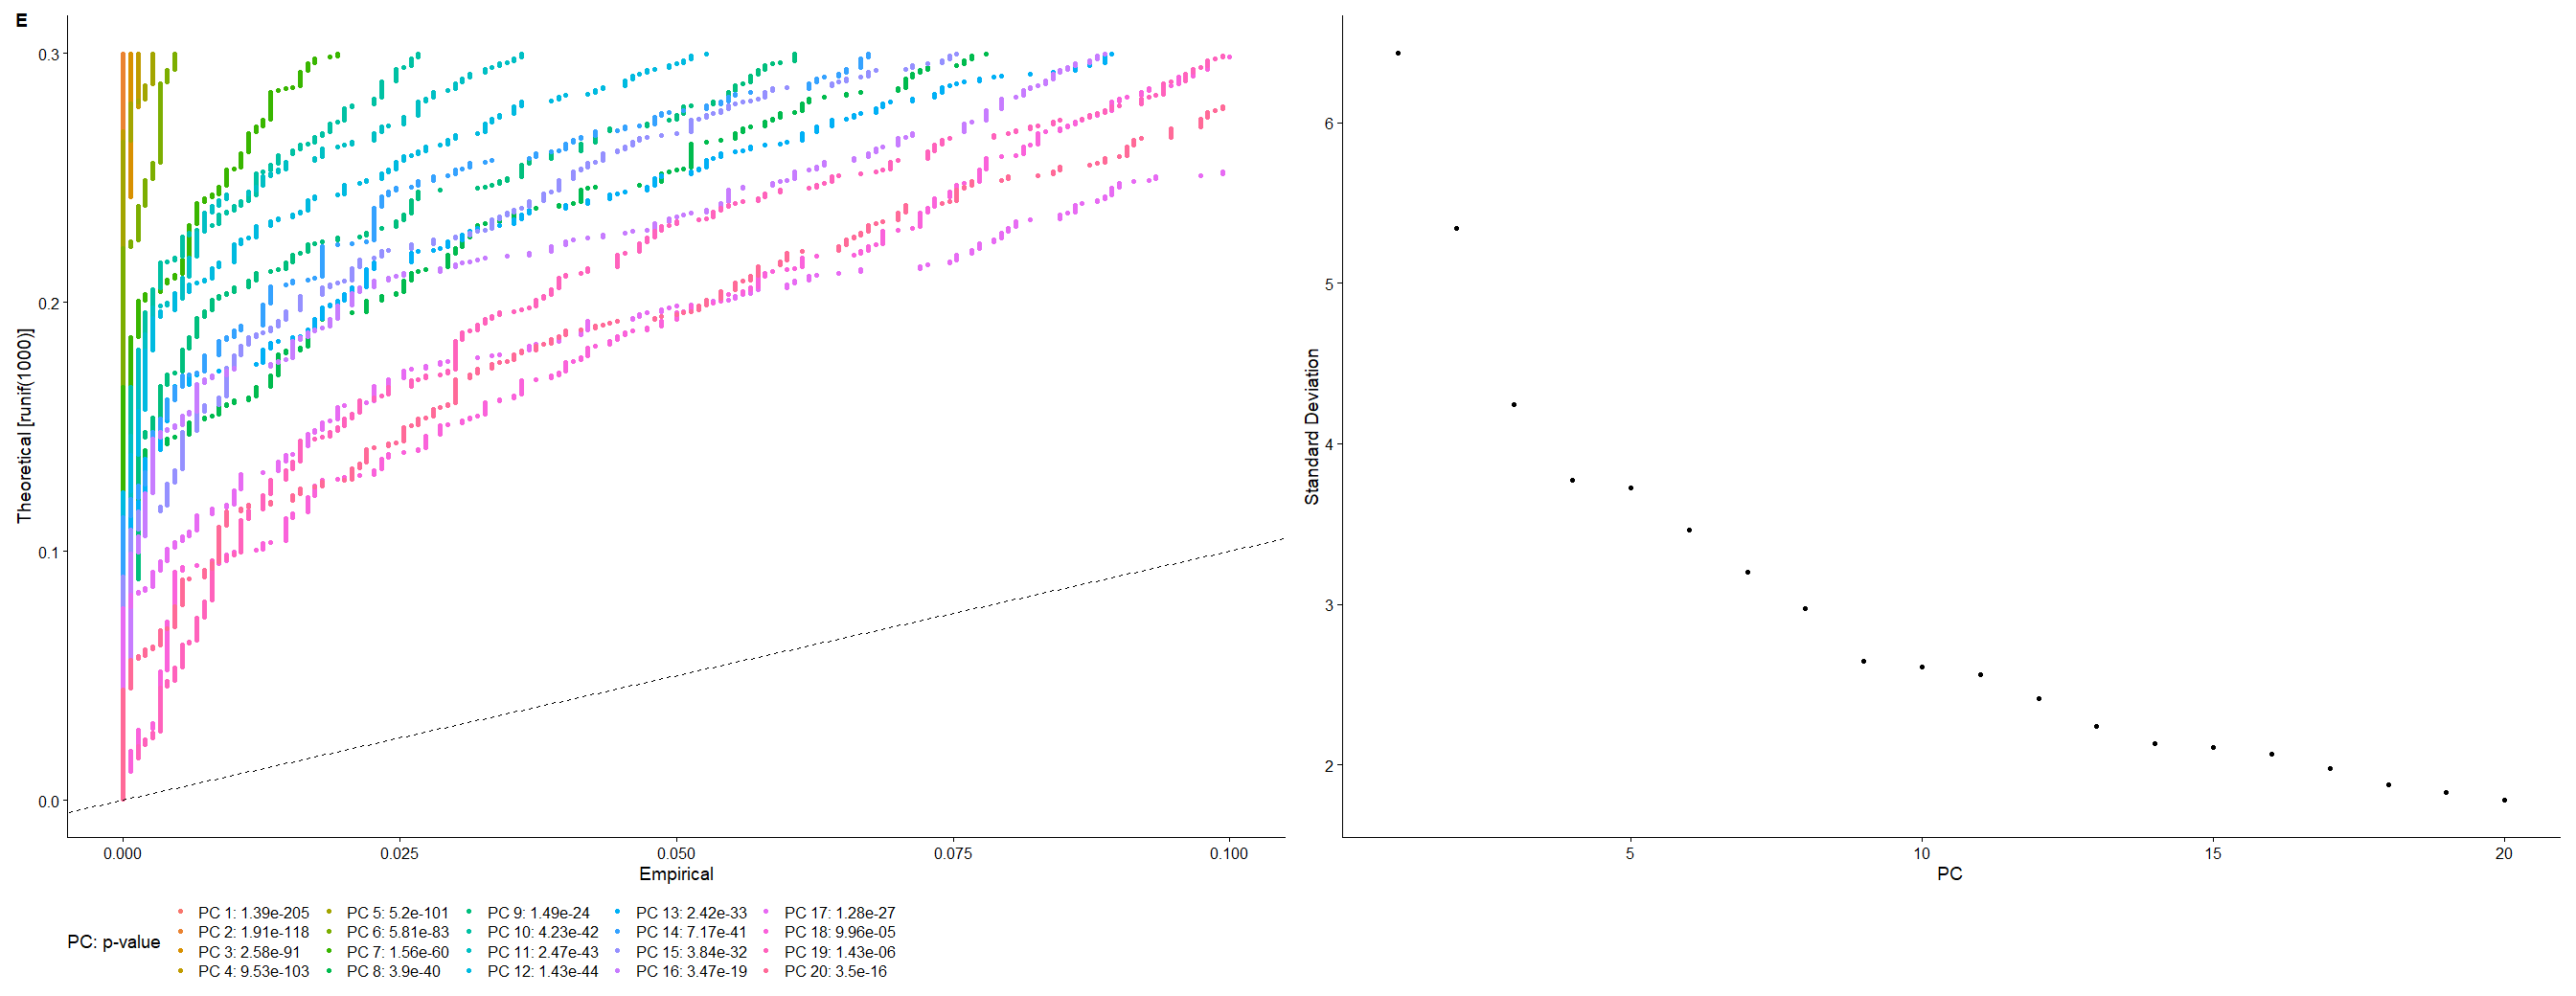
#挑选主成分,RunPCA 默认保留了前 50 个 | |
scRNA <- JackStraw (scRNA,reduction = "pca", dims=20) | |
scRNA <- ScoreJackStraw (scRNA,dims = 1:20) | |
p2_2 <- JackStrawPlot (scRNA,dims = 1:20, reduction = "pca") + | |
theme (legend.position="bottom") + | |
labs (tag = "E") | |
p2_2 | |
p2_3 <- ElbowPlot (scRNA, ndims=20, reduction="pca") | |
p2_2 | p2_3 |
<center>
E 图
</center>
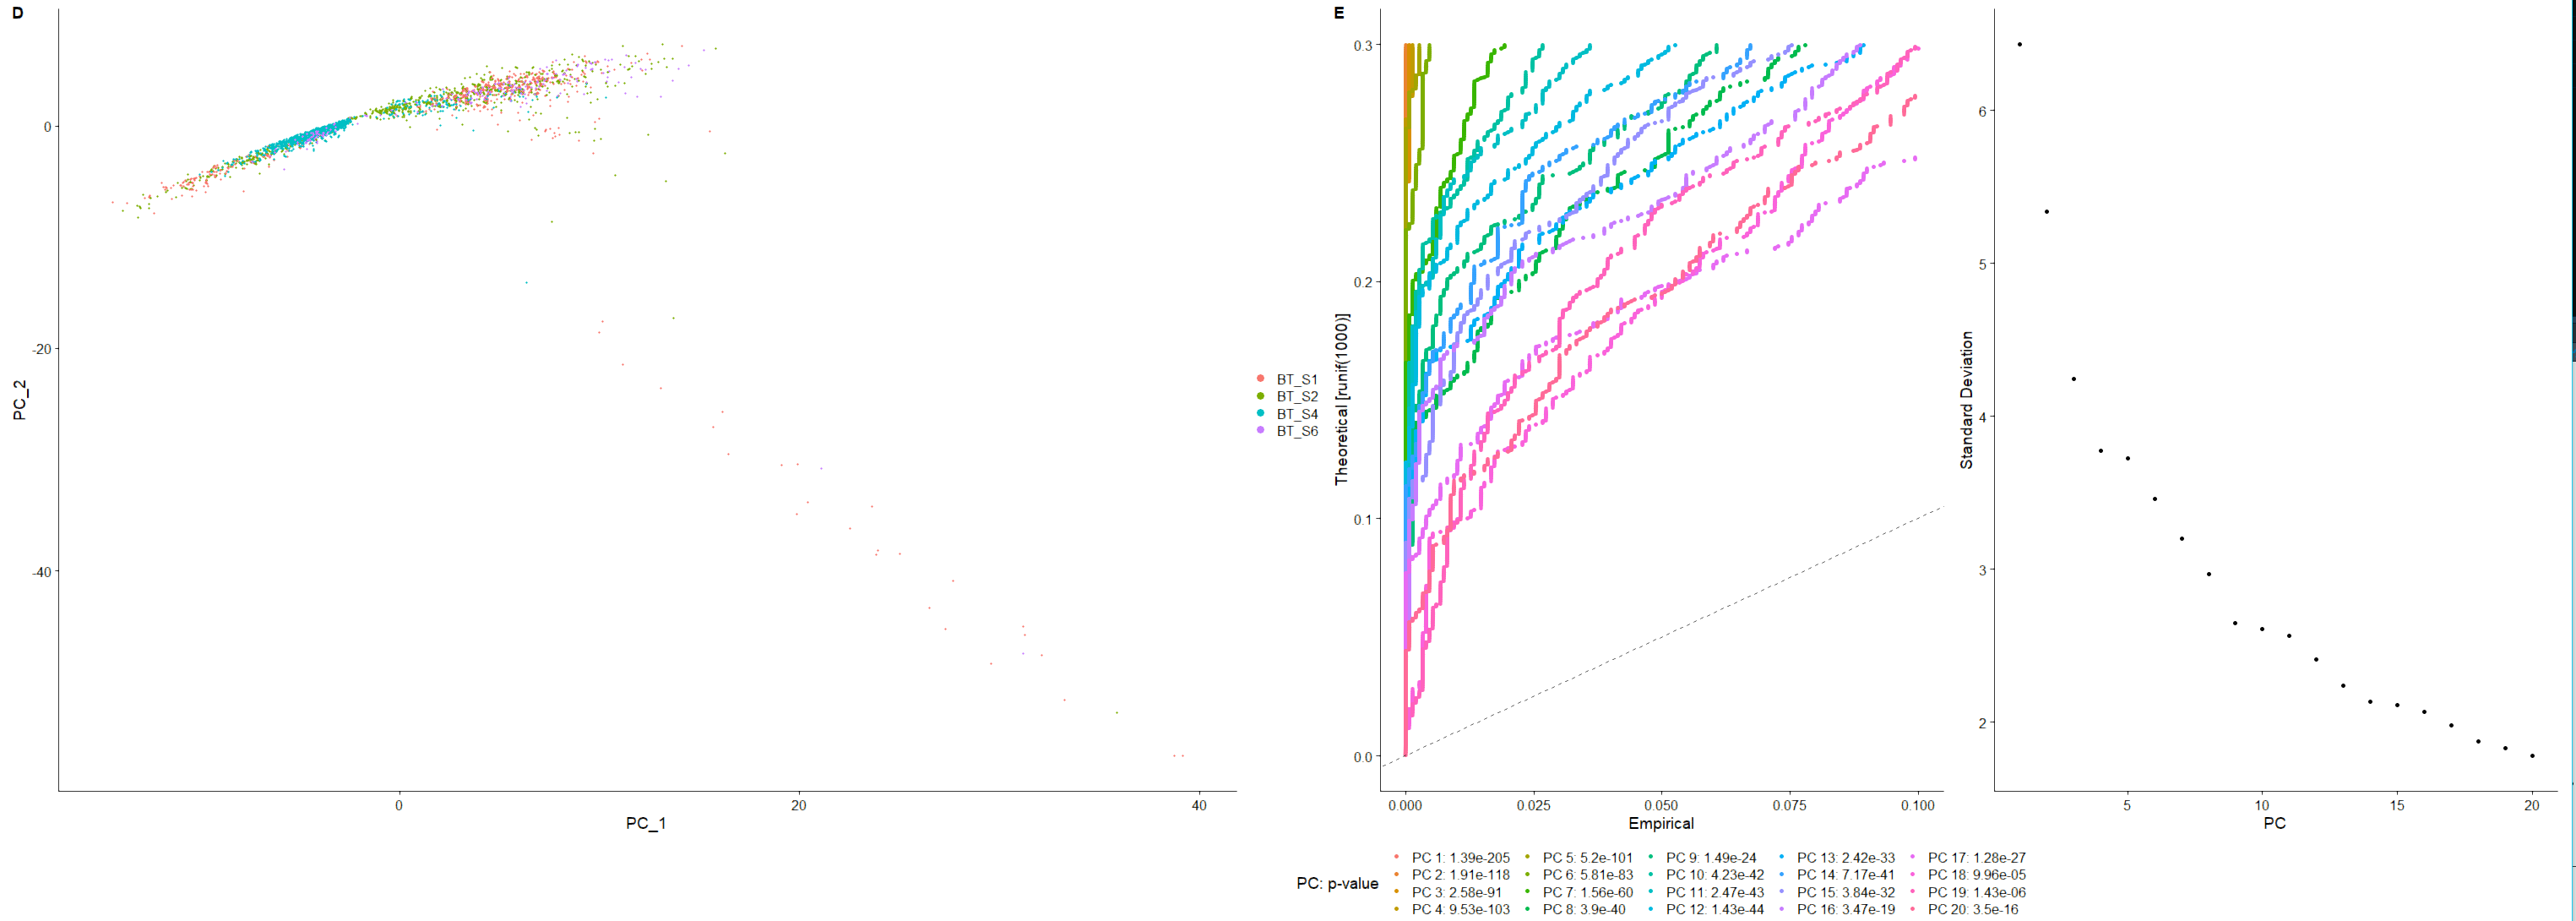
<center>
D 图与 E 图
</center>
# 聚类、筛选 maker 基因并可视化
# 聚类
pc.num=1:20 | |
# 基于 PCA 数据 | |
scRNA <- FindNeighbors (scRNA, dims = pc.num) | |
# dims 参数,需要指定哪些 pc 轴用于分析;这里利用上面的分析,选择 20 | |
scRNA <- FindClusters (scRNA, resolution = 0.5) | |
table (scRNA@meta.data$seurat_clusters) | |
scRNA = RunTSNE (scRNA, dims = pc.num) | |
DimPlot (scRNA, reduction = "tsne",label=T) | |
p3_1 <- DimPlot (scRNA, reduction = "tsne",label=T) + | |
labs (tag = "E") | |
p3_1 |
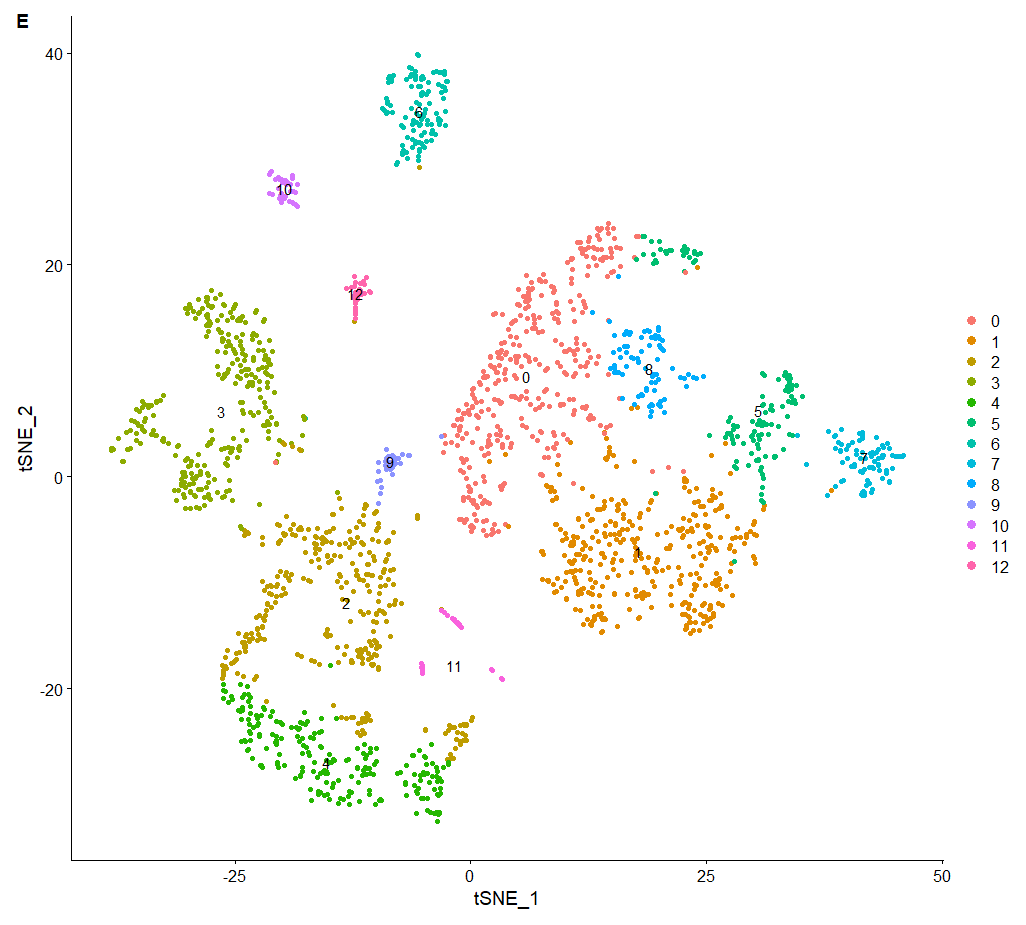
<center>
F 图
</center>
# 筛选 maker 基因
#5.2 marker gene | |
# 进行差异分析,一般使用标准化数据 | |
scRNA <- NormalizeData (scRNA, normalization.method = "LogNormalize") | |
# 结果储存在 "data"slot 里 | |
GetAssayData (scRNA,slot="data",assay="RNA")[1:8,1:4] | |
#if test.use is "negbinom", "poisson", or "DESeq2", slot will be set to "counts | |
diff.wilcox = FindAllMarkers (scRNA)## 默认使用 wilcox 方法挑选差异基因,大概 4-5min | |
load ("../diff.wilcox.Rdata") | |
head (diff.wilcox) | |
dim (diff.wilcox) | |
library (tidyverse) | |
all.markers = diff.wilcox %>% select (gene, everything ()) %>% | |
subset (p_val<0.05 & abs (diff.wilcox$avg_logFC) > 0.5) | |
#An adjusted P value < 0.05and | log 2 [fold change (FC)] | > 0.5 | |
#were considered the 2 cutoff criteria for identifying marker genes. | |
dim (all.markers) | |
summary (all.markers) | |
save (all.markers,file = "../markergene.Rdata") | |
top10 = all.markers %>% group_by (cluster) %>% top_n (n = 10, wt = avg_logFC) | |
top10 | |
top10 = CaseMatch (search = as.vector (top10$gene), match = rownames (scRNA)) | |
top10 | |
length (top10) | |
length (unique (sort (top10))) | |
p3_2 <- DoHeatmap (scRNA, features = top10, group.by = "seurat_clusters") | |
p3_2 | |
p3_1 | p3_2 #下图 |
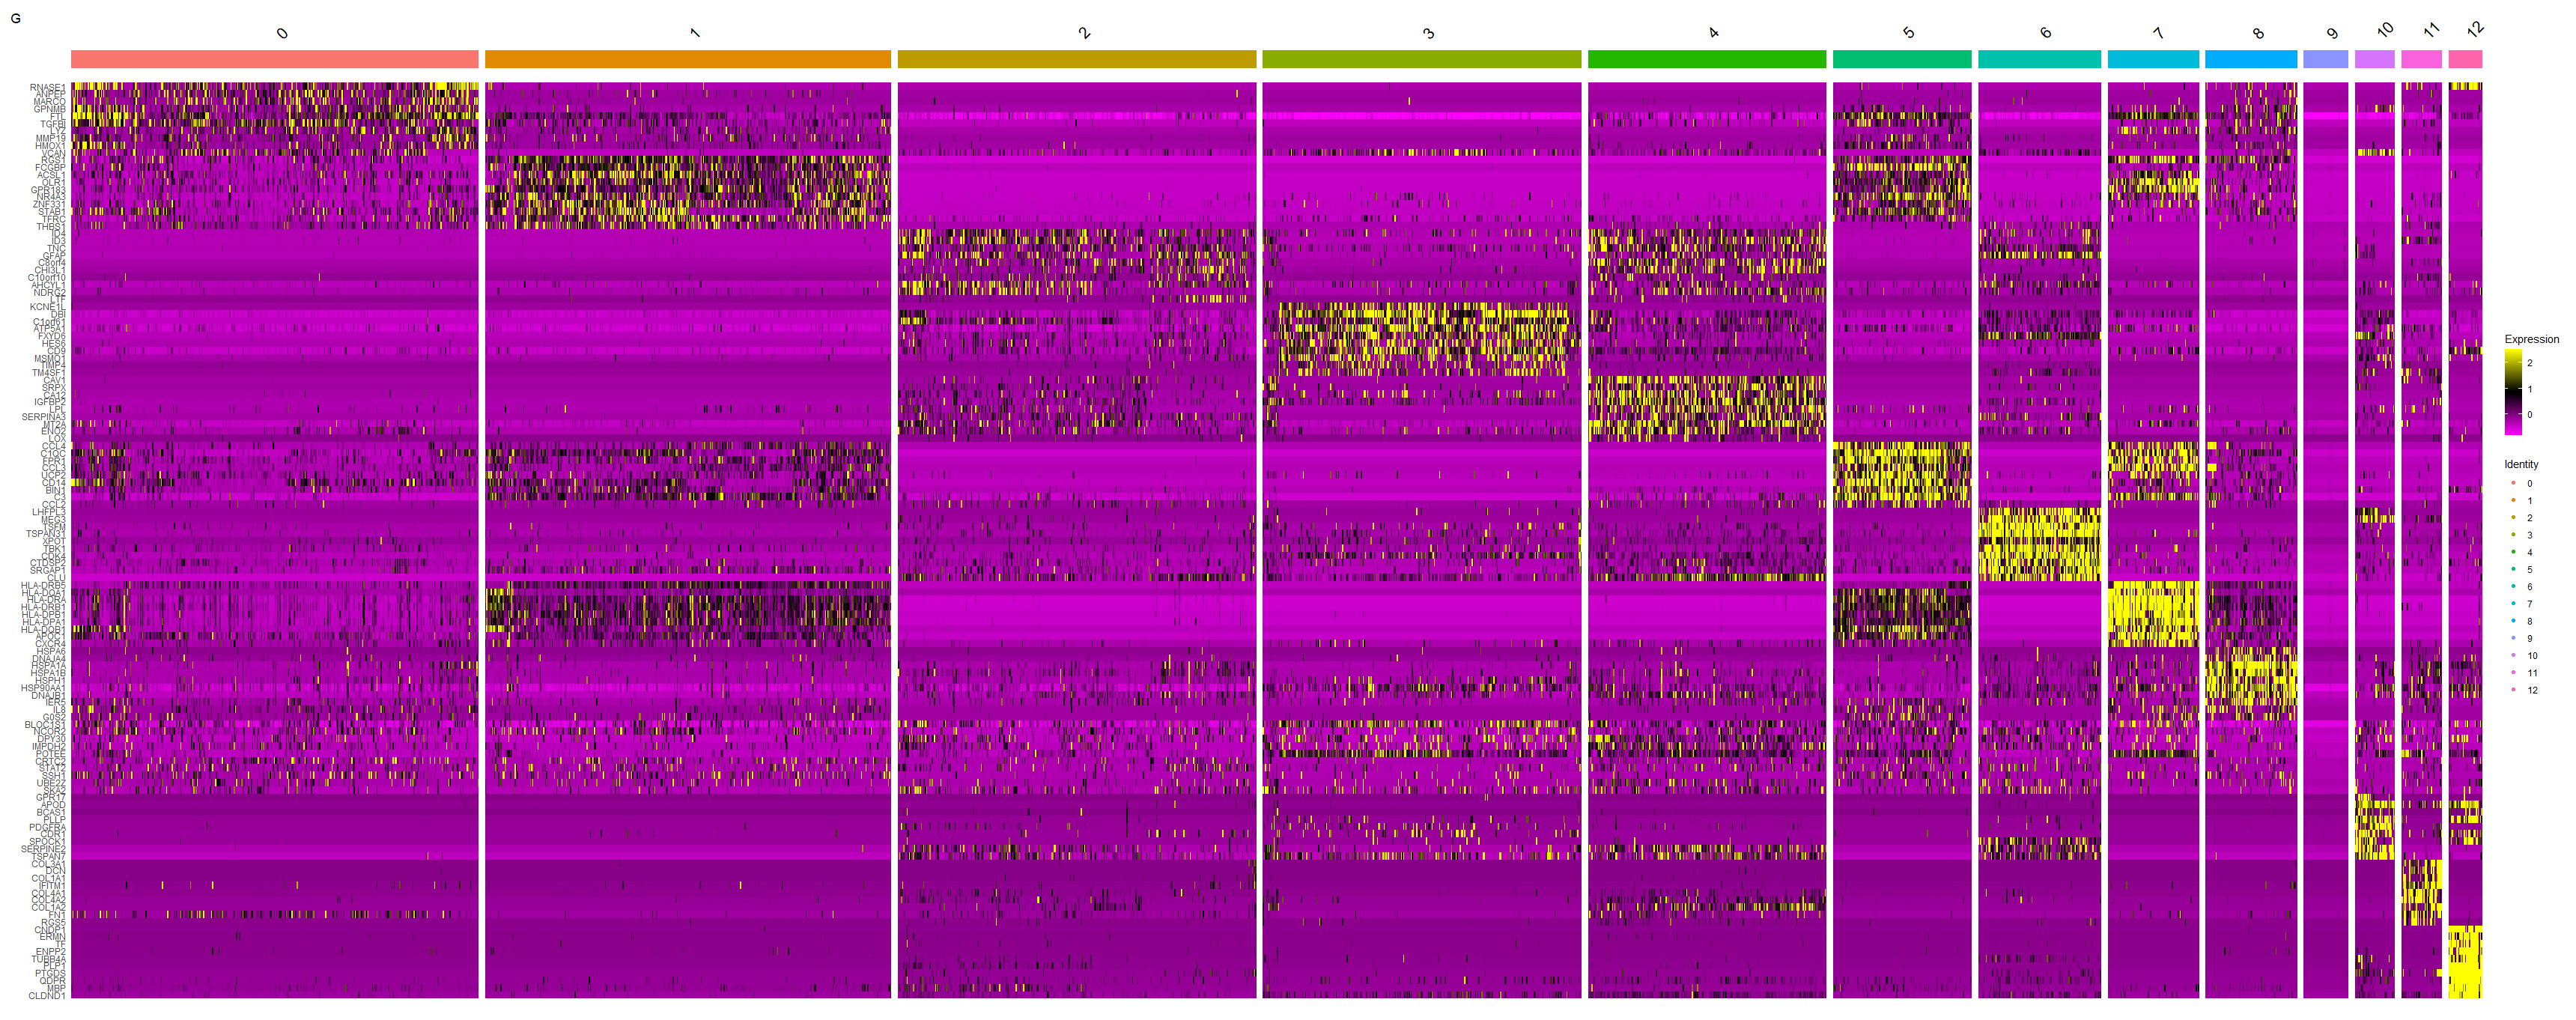
<center>
G 图
</center>
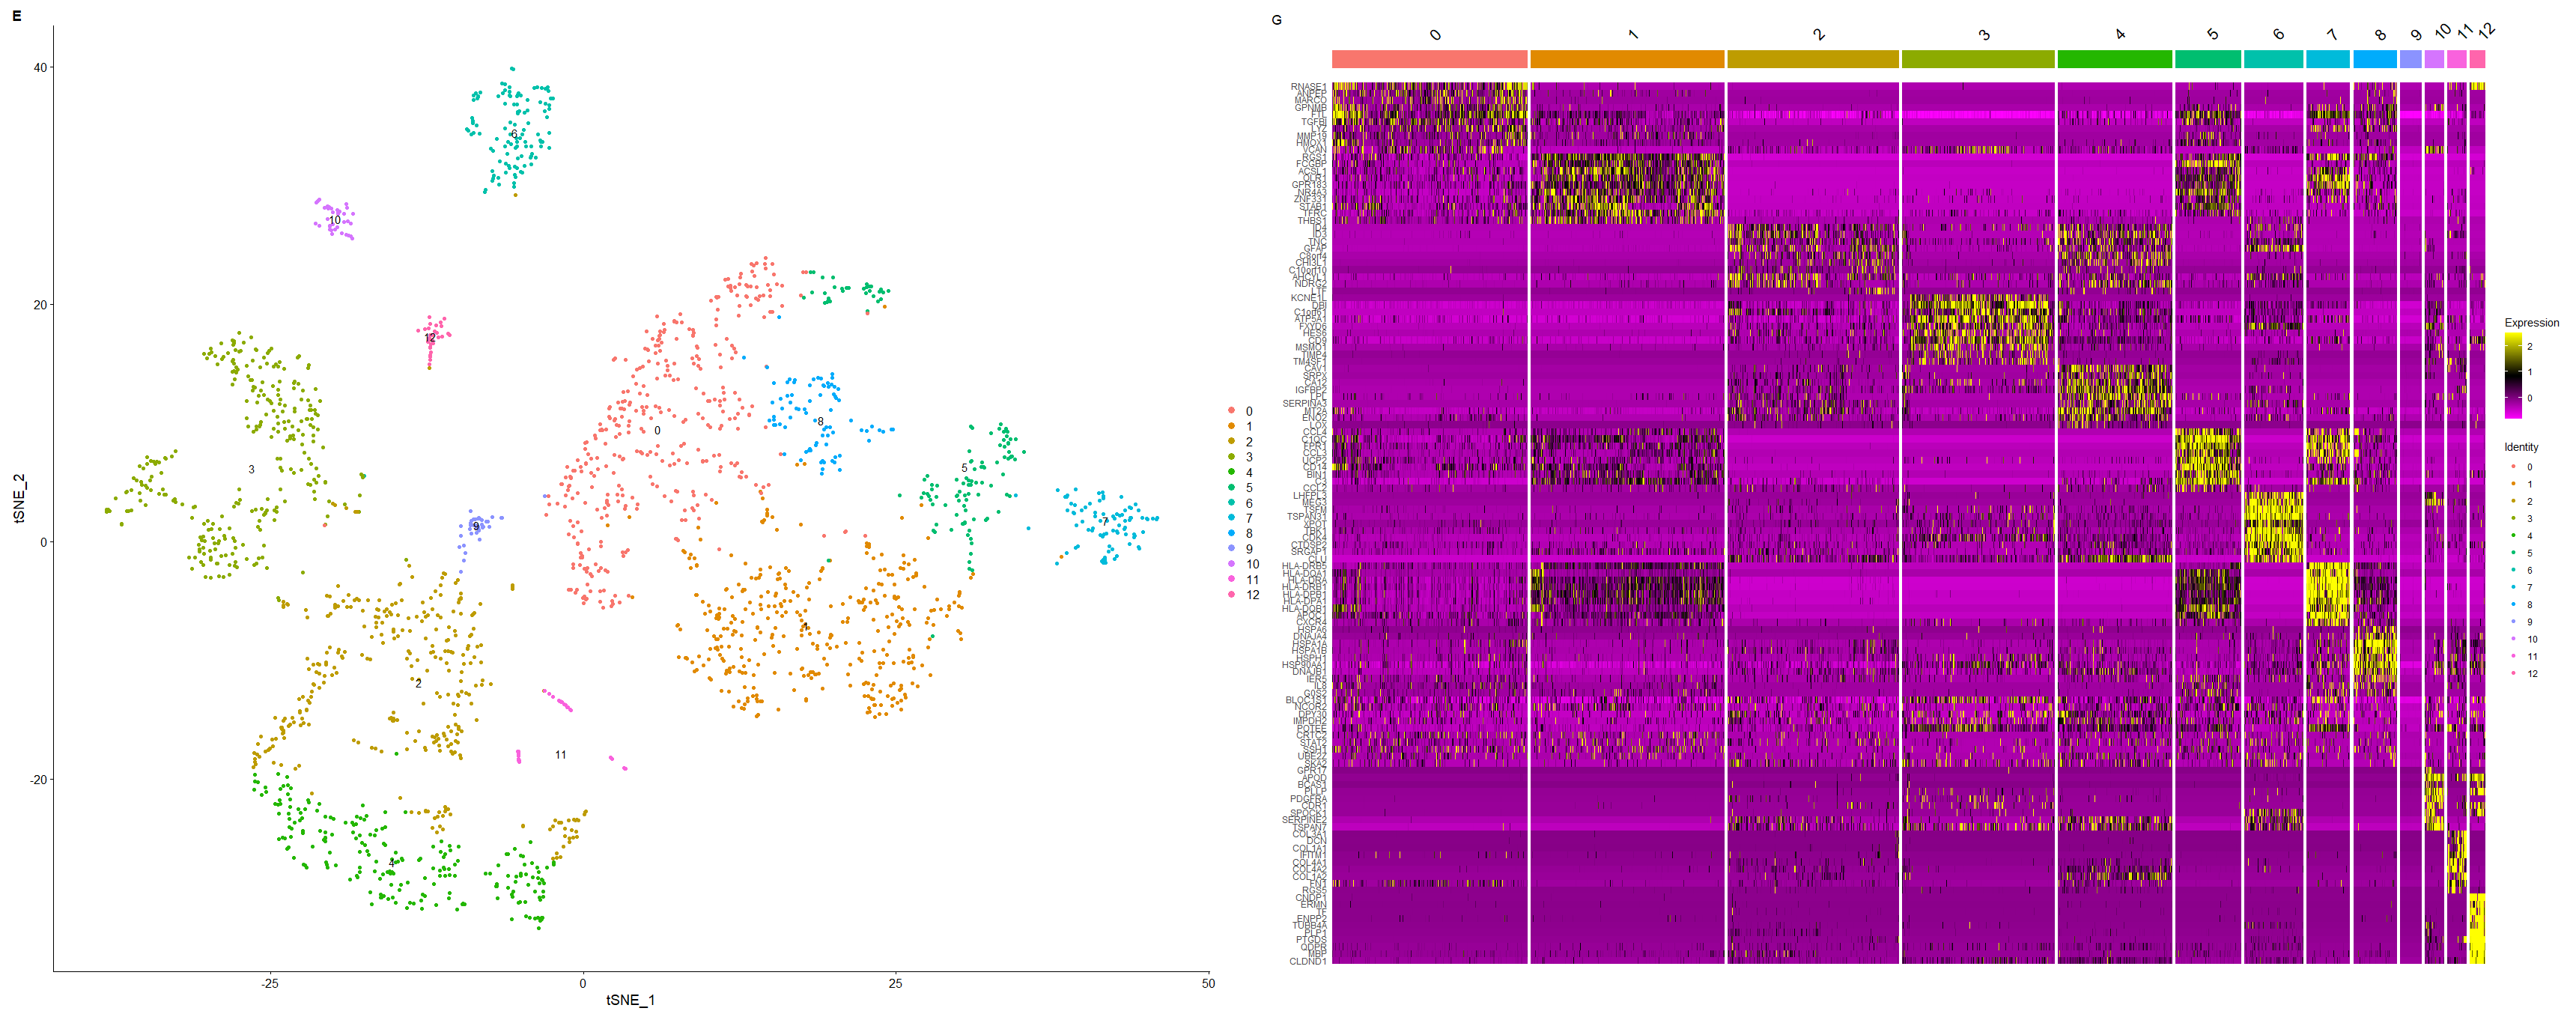
<center>
图片合并
</center>
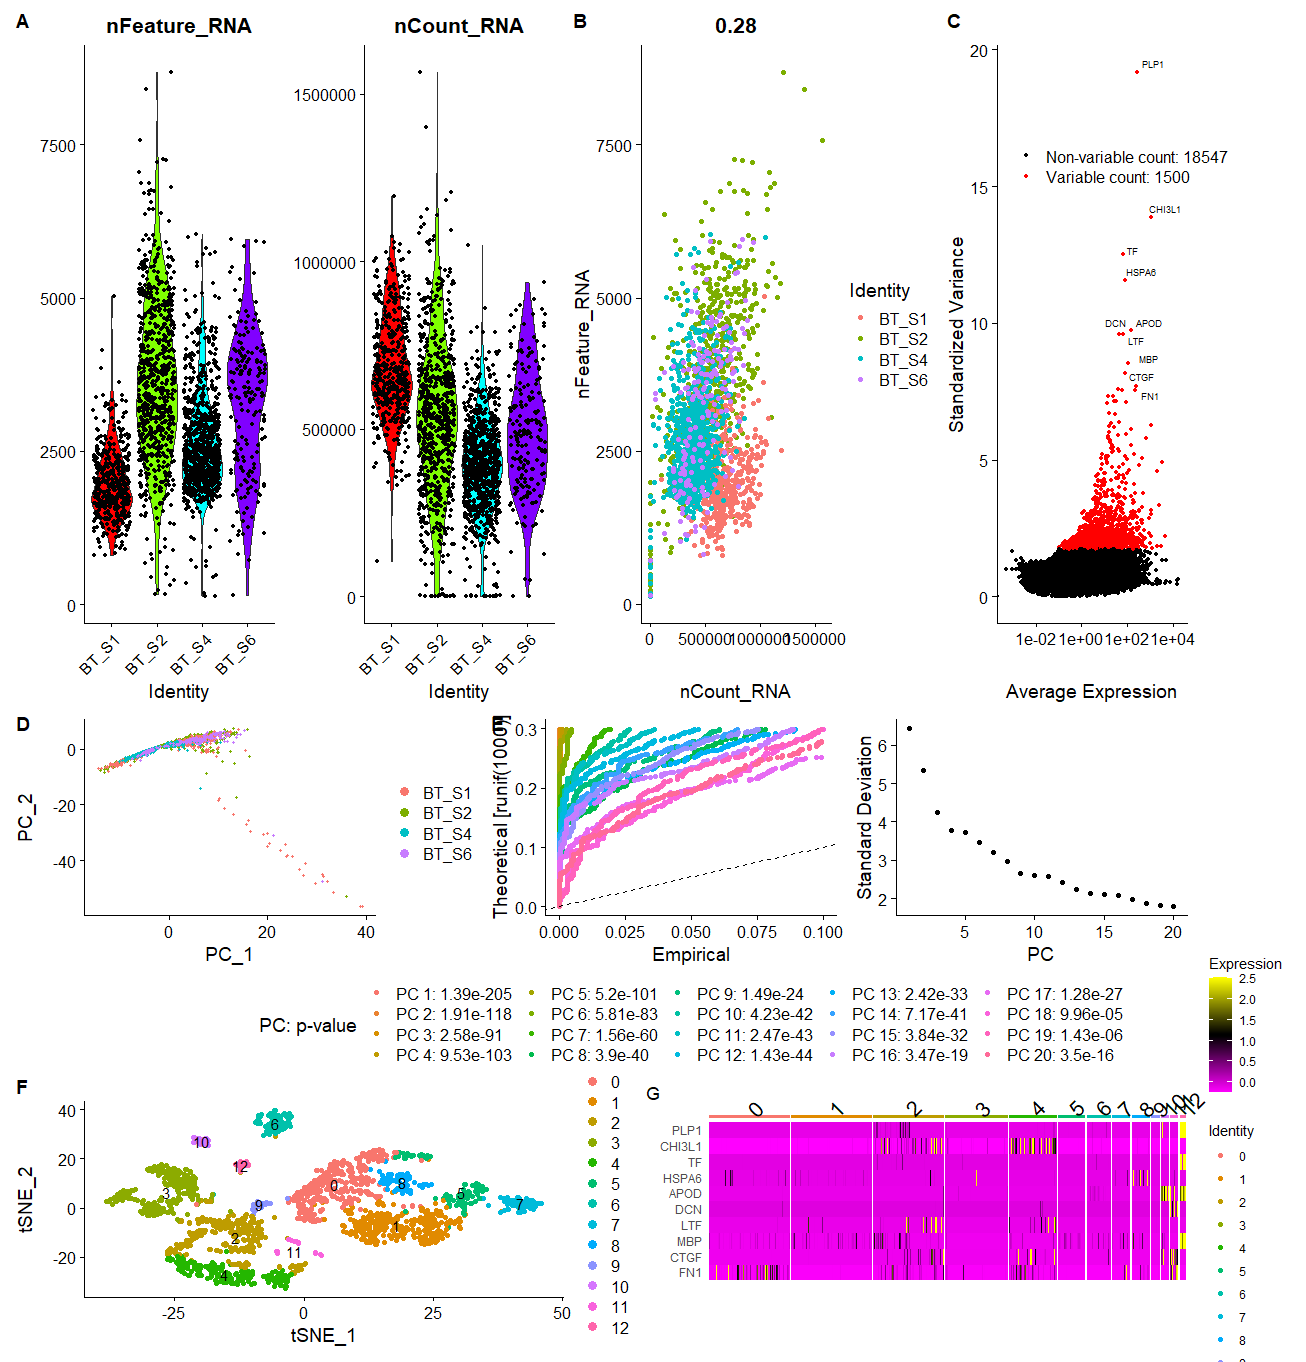
目前,图一的图片已经全部完成,接下来将进行拼图
# 拼图
### 6、拼图,比较 ---- | |
p <- (p1_1 | p1_2 | p1_3) / | |
((p2_1| p2_2 | p2_3) / | |
(p3_1 | p3_2)) | |
ggsave ("../.my_try.pdf", plot = p, width = 15, height = 18) | |
save (scRNA,file = "scRNA.Rdata") |
